TABLE OF CONTENTS
Introduction
The Quality and Outcomes Framework (QOF) is a voluntary annual program for GP Practices in England, rewarding them financially for meeting quality and outcomes in clinical care and public health. It covers chronic conditions, public health issues, and preventive services. Practices earn points for meeting QOF targets, with points weighted by practice size and condition prevalence. The QOF dashboard, available to National Contract Subscribers, to visualise performance in points value and achievements.
Accessing the Dashboard
Select the Contracts icon, followed by QOF 2026-27 contract.

Navigating the Dashboard
The dashboard will open on the Overview tab by default. This will show your organisations current achievement vs total points available. The contract can be viewed in full using the Overview tab, however you can also use the tabs across the top of the page to view your data and progress by domain.

You can view your data and details of the contract by using one of the following 4 options available:
- Data - Shows QOF achievement in point value.
- Payment - Shows QOF achievement in monetary value. (*Coming soon)
- Rules - Shows a breakdown of the reporting rules and accepted code sets.
- Contract - Allows access to the contract business rules.

Within the QOF dashboard you can track all QOF domains and indicators from two perspectives: 'How am I Driving' and 'End of Year Financial Year' by using the toggle.

Data Tab
The Data tab will show QOF achievement in terms of points and progress.
The Clinical Activity section will list each QOF indicator across all domains.

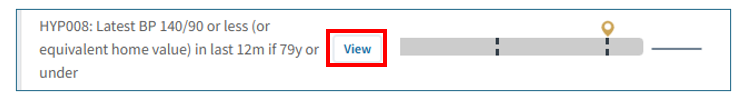
You can track your percentage achieved and see if you have met the lower or upper threshold using a visual bar. The dark gray color represents your progress, while the dotted lines indicate the minimum and maximum thresholds. The percentage values of these thresholds are also documented in the threshold column.

The Achieved columns will use a visual traffic light system to show how your organisation is performing for each indicator:
- Red - Below the minimum threshold (no points/payment).
- Amber - Between thresholds. Your points will start increasing as you progress toward the next threshold.
- Green - Met or exceeded the maximum threshold (full points/payment).
The Patient column will display the number of patients who are eligible for the indicator and how many achieved.

The Remaining to Achieve column highlights the number of points outstanding as well as the number of patients required to reach the maximum threshold.
The columns can be sorted, allowing you to reorder how the reports are displayed. Click on the word Points to reorder the number of outstanding points, or click on the person to sort by the number of outstanding patients.
You can also filter your remaining patients to show the amount needed to reach the minimum threshold.

The Case Finder section will identify patients missing from the practice disease registers, due to missing or incorrect coding.

The Domains section shows an overview of current performance by each QOF domain.

Payment Tab
The Payment tab will show the QOF achievement for Clinical Activity and Case Finders searches in monetary value, helping practices visualise the financial impact of work outstanding.
The Remaining to Achieve columns include:
 | Total amount outstanding |
 | Points remaining until maximum threshold (excluding Case Finders) |
 | Number of patients outstanding to reach the selected threshold |
 | Indicator value (pound per patient) |
Columns on this tab can be sorted by Achieved or Remaining to Achieve to help prioritise work. To do this click on the preferred icon to sort the data to your preference.
There is also a domain overview at the bottom of this page.
Rules Tab
The rules for each report/indicator can be easily identified via the Rules tab.
Click on the report you want to view. The Rules pane will open to the right. This will detail the source of the report, the report it is linked to and the rules in the report. Relevant code sets can be identified by clicking on the blue hyperlinks. These will open in a separate screen.

Rules can also be located when viewing a single report by clicking on the Rules tab.

Contract Tab
The Contract tab offers a clear, user-friendly breakdown of each component of the QOF Contract, enabling you to view all contract details in one place.

The Payment section shows how the payment framework operates including confirmation of the national point value. Clicking on the ‘i’ next to the point payments gives a further explanation of how this type of payment framework works.

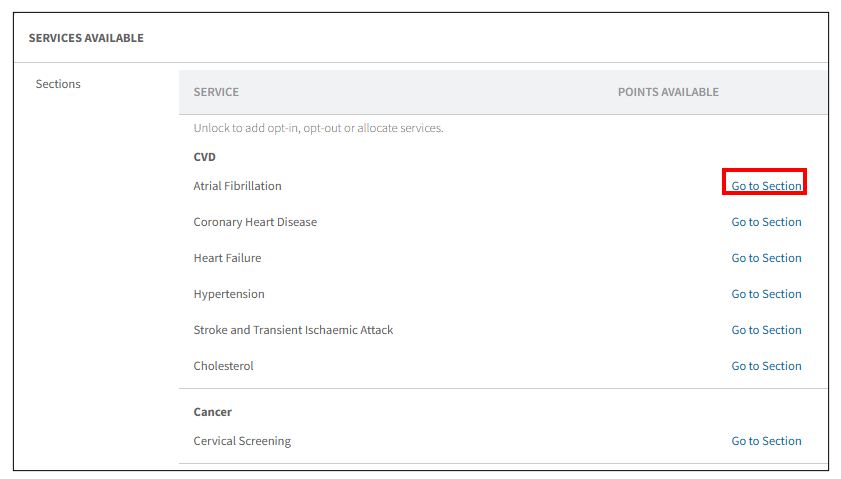
The Services Available section outlines the specifications for each QOF domain, including payment thresholds. To explore this in more detail, click on Go to Section. There, you will find a comprehensive breakdown of the criteria for each domain and category, along with the required thresholds and point values for each indicator.
Export Options
You can easily export the data from the QOF Dashboard when needed. There are two export options available:
- Page View (.pdf): Export the current page as a PDF, which can be printed or shared electronically
- For Organisation (.csv): Export the data as a CSV file, allowing you to format and analyse it in your own spreadsheet. (This option only exports the clinical activity section of the page)
To export your information, click the Export button in the top right corner of the page and select your preferred format.

How to View Reports
To see more details of a report, click the View button next to the report name.
Once you select a report, you can view the corresponding patient list by clicking on the
Patients tab. You can refine this list to show all patients, only those who have achieved the indicator, or those who are still outstanding. For more information on using the patient list in Ardens Manager, see our detailed support article
Viewing Patient Level Data.
Additional insights are available, including patient demographics, staff-level data, and trend analysis. You can also benchmark your data against other practices within your PCN, provided the appropriate data sharing agreement is in place. For step-by-step guidance on using these tools to better understand your data and patient population, explore our detailed
support articles.
Additional Learning
Further support articles are available to make the most of the QOF dashboard, access the support articles using this link.
For further learning on how to use the QOF dashboard, we recommend enrolling onto the
QOF Dashboard module on Ardens Academy.

If you require any further assistance on the process above, please contact the Ardens Support Team on: support@ardens.org.uk