TABLE OF CONTENTS
Introduction
Capitation might sound like a technical term, but it is actually a simple idea at the heart of how GP practices are funded. In short, your practice gets a set amount of money for each patient registered with you, regardless of how often they come in. That is why keeping an eye on your patient list is not just good admin, it is essential for your funding.
This is where the Population Dashboard in Ardens Manager comes in. It gives you a clear view of patient movements, in particular new registrations, deductions, births, and deaths, so you can stay on top of changes that directly impact your capitation income. Whether you are planning resources, reviewing trends, or just making sure your data is up to date, this dashboard helps you make informed decisions.
Accessing the Population Dashboard
Select the Services icon and click on Population.

Navigating the Population Dashboard
By default, the dashboard will open on the Overview tab.
Capitation
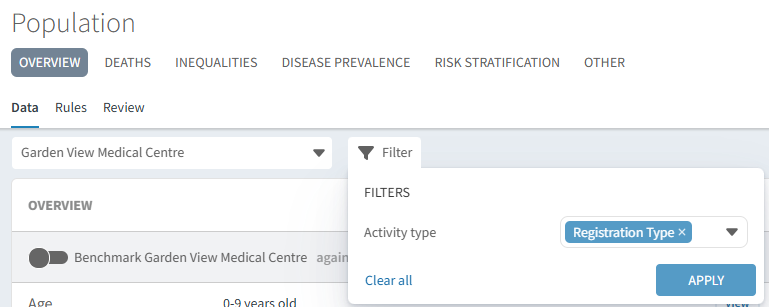
To monitor your Capitation, scroll down the page to the section titled Registration Type.
Alternatively, you can filter your dashboard using the filter icon. Select your activity type as Registration Type and click Apply.
You can view the number of registered patients for each registration type and the number of patients registered last month.

To monitor any trends in your capitation data, click View.

Use the Trend chart to visually monitor the trends for your capitation data.
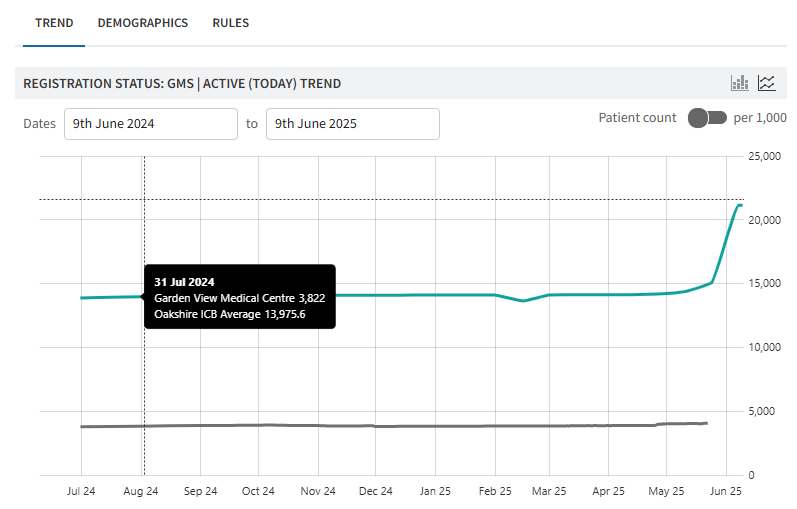
The chart will default to the past 12 months. To view a date range prior to this, use the date picker to enter a new date range. Click on the start and end date, then click on Select.

Patient Movements
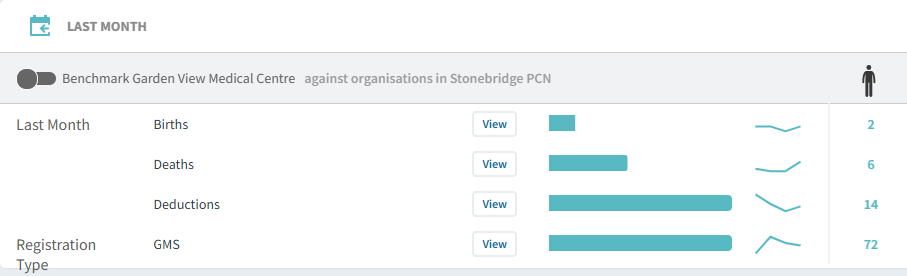
To monitor your patient's movements, scroll down the page to the section titled Last Month.
Alternatively, you can filter your dashboard using the filter icon. Select your activity type as Last Month and click Apply.

You can now view how many patients you have in each category for the previous month.
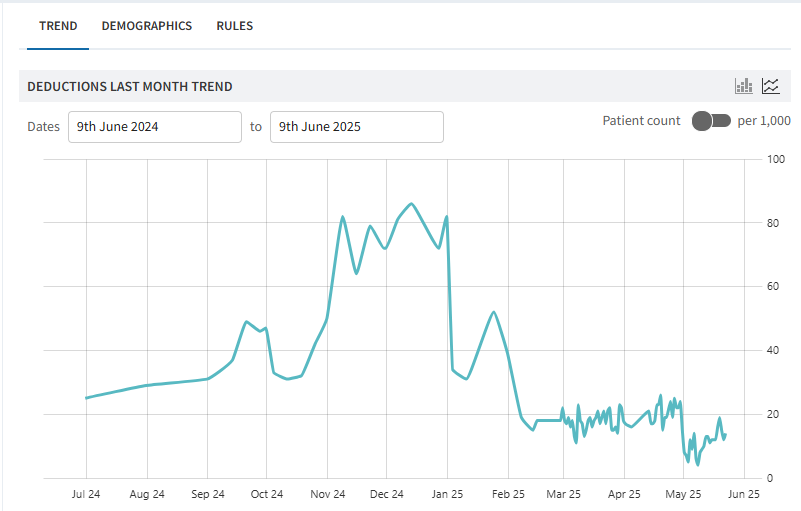
To monitor any trends in your patient movements, click View.

Use the Trend chart to visualise the movements in your patient data as well as look for trends using the Demographics tab.

Next Steps
You can now compare your data for each category to understand what the movements of your patients are. Are your registrations or deductions consistently increasing? This may indicate your practice is growing or reducing. Perhaps it's time to review your capacity and resource requirements.
Why not try the following:
- Evaluate your Workforce data to get an understanding of your current capacity.
- Calculate how many Long Term Condition Review appointments may be needed how you may prioritise the workload using the data from the Disease Prevalence or Conditions Dashboards
- See how many patients need reviews or intervention via the QOF Dashboard to evaluate if you have enough resource to complete the contractual work within the specified timeframe.
If you require any further assistance on the process above, please contact the Ardens Manager Support Team on: support-manager@ardens.org.uk