TABLE OF CONTENTS
Introduction
The Network Contract DES dashboard is available to
National Contract Subscribers and allows organisations to monitor Network Contract DES requirements such as IIF, Additional Roles Reimbursement Scheme and Capacity and Access.
Accessing the Network DES Dashboard
Select the Contracts icon, followed by Network Contract DES '26-27.

Navigating the Network DES Dashboard
By default, the dashboard opens on the Overview page, where you can see your current points earned compared to the total points available. A visual bar chart displays your progress across each domain. You can view the full contract from the Overview tab or use the tabs at the top of the page to explore your data and progress by individual domain.

You can view your data and contract details using one of the following four options:
- Data - Displays QOF achievement in point value.
- Payment - Displays QOF achievement in monetary value.
- Rules - Provides a breakdown of the reporting rules and accepted code sets.
- Contract - Allows access to the contract business rules.

Within the Network DES dashboard, you can track all domains and indicators from two perspectives: 'How am I Driving' and 'End of Year Financial Year' by using the toggle.

Data Tab
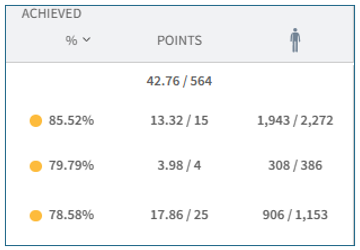
The Data tab will show contract achievement in terms of points and progress. The Clinical Activity section will list all reports and indicators across each domain. Organisational Activity covers elements that are subject to block payment. The reports on the overview tab automatically only show the first three reports. To see all reports in a section, click on Show all.

Track your percentage achieved and whether you have met the lower or upper threshold using the visual bar. The dark gray color represents your progress, while the dotted lines indicate the minimum and maximum thresholds (where applicable). The percentage values of these thresholds are also documented in the threshold column.

The Achieved columns will indicate, using a visual traffic light system, how your organisation is performing for each indicator:
- Red - below minimum threshold (no points/payment).
- Amber – Between thresholds. You will start to see your number of points increasing as your progress towards the next threshold.
- Green – Met or exceeded maximum threshold (full points/payment).
The Patient column will display the number of patients achieved out of the cohort eligible for the indicator.
The Remaining to Achieve column highlights the number of points outstanding as well as the number of patients required to reach the maximum threshold.
The columns can be sorted allowing you to re-order how the reports are displayed. Click on the word Points to re-order the number of points outstanding or click on the person to sort by number of patients outstanding.
You can also filter your remaining number of patients to show the amount needed to reach the minimum threshold.

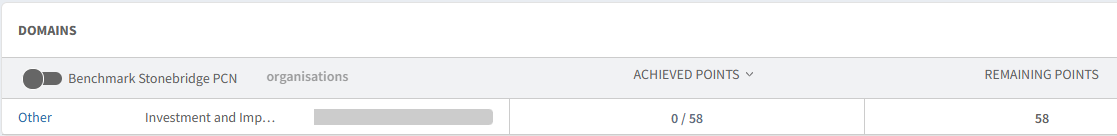
The DOMAINS section shows an overview of current performance by each QOF domain.
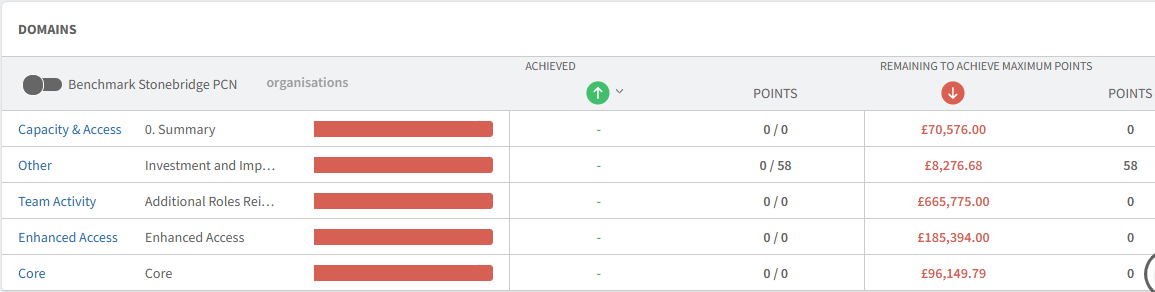
Payment Tab
The Payment tab will show achievement in financial value, helping practices and PCNs understand the financial impact of work outstanding.

The Remaining to Achieve columns include:

 | Total amount outstanding |
 | Points remaining (excluding block payments) |
 | Number of patients outstanding to reach the selected threshold |
 | Indicator value (pound per patient) |
 | Maximum/Minimum Filter (to display number of patients to reach maximum or minimum threshold) |
Columns on this tab can be sorted by Achieved or Remaining to Achieve to help prioritise work. To do this click on the preferred icon to sort the data to your preference.

There is also a DOMAIN overview at the bottom of this page.
Rules Tab
Rules for all reports can be found using the Rules tab on the dashboard.
Click on the report you want to view the rules for. A page will open to the right. This will detail the particulars of the search. To view any code sets included, click on the blue hyperlinks.


Rules can also be located when viewing a single report by clicking on the 'rules' tab.

Contract Tab
The Contract tab provides a clear, user-friendly breakdown of each component of the QOF Contract allowing you to view all contract details in one place.

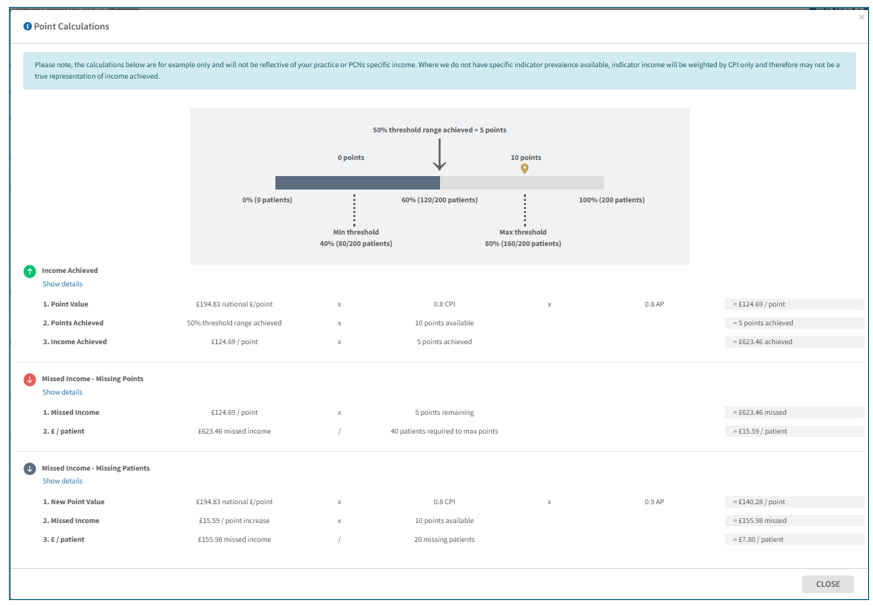
The Payment section shows how the payment framework operates including confirmation of the national point value. Clicking on the ‘i’ next to the point payments gives a further explanation of how this type of payment framework works.

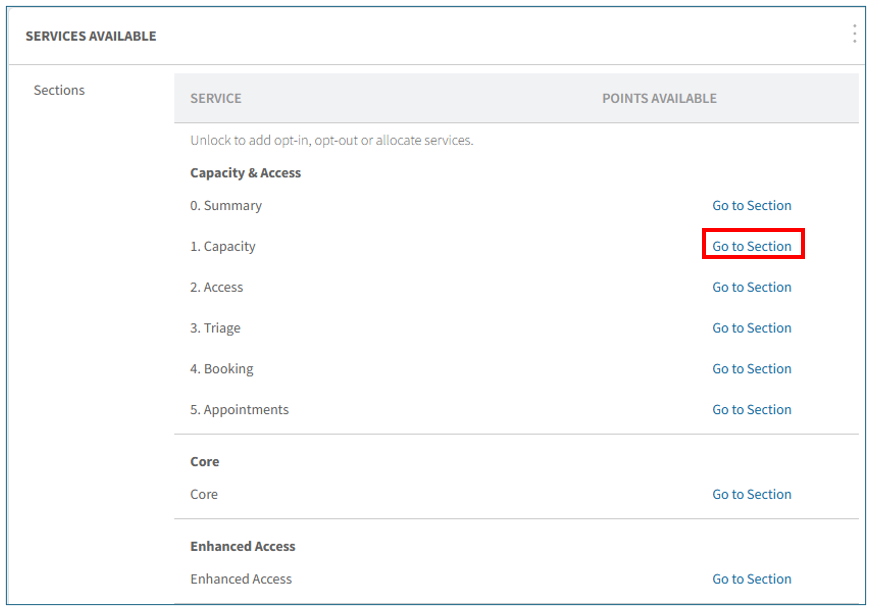
The Services Available section outlines the specifications for each domain of the Network DES, including payment thresholds where applicable. To explore this in more detail, click on Go to Section. There, you will find a comprehensive breakdown of the criteria for each domain and category, along with the required thresholds and point values for each indicator.
You can also access the rules for each report by clicking the information icon ‘i’ next to the report title.

Export Options
You can easily export the data from the Network DES Dashboard whenever needed. There are two export options available:
- Page View (.pdf) - Export the current page as a PDF, which can be printed or shared electronically.
- For Organisation (.csv) - Export the data as a CSV file, allowing you to format and analyse it in your own spreadsheet. (This option only exports the clinical activity section of the page.)
To export your information, click the Export button in the top right corner of the page and select your preferred format.

How to View Report Breakdown
To see more details of a report, click the View button next to the report name.
Once you select a report, you can view the corresponding patient list by clicking on the
Patients tab. You can refine this list to show all patients, only those who have achieved the indicator, or those who are still outstanding. For more information on using the patient list in Ardens Manager, see our detailed support article
Viewing Patient Level Data.
Additional insights are available, including patient demographics, staff-level data, and trend analysis. You can also benchmark your data against other practices within your PCN, provided the appropriate data sharing agreement is in place. For step-by-step guidance on using these tools to better understand your data and patient population, explore our detailed
support articles.
Continuity of Care
Ardens Manager can be used to identify continuity of care need through multiple risk stratification tools. Access our support article for more information.
Additional Learning
To learn more about our clinical system resources that support data entry for the IIF, check out our support articles for
SystmOne and
EMIS Web. These guides provide helpful instructions on accessing and using the data entry templates, as well as the searches available in your reporting module.
For further learning on how to use the IIF dashboard, we recommend enrolling onto the
Network Contract DES Ardens Academy guide.
